Live Solar PV
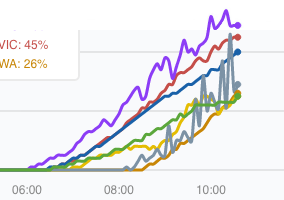
View live dataLive performance data from nationwide PV installations, with total electricity demand and PV contribution
 View tool
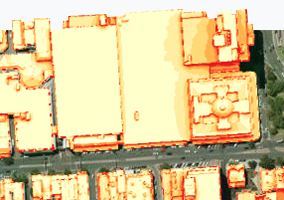
SunSPoT
Rooftop solar mapping tool using 3D data, for assessing annual and per-month PV potential in urban environments
 View map
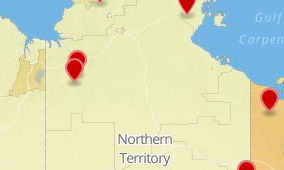
Solar PV Status
Estimated percentage of houses with PV systems and total installed capacity, by postcode and LGA
 View analyses
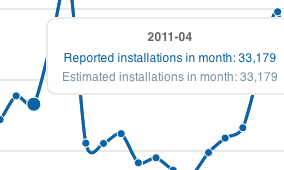
Market Analyses
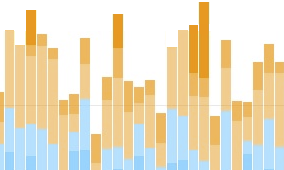
Charting per-month PV installations registered under the Commonwealth Government’s Renewable Energy Target
 View data
PV Postcode Data
Explore PV installations by postcode and system size, with per-month installation figures since 2007